

Benchmarks
Within ×1.2 of hand-written JavaScript.
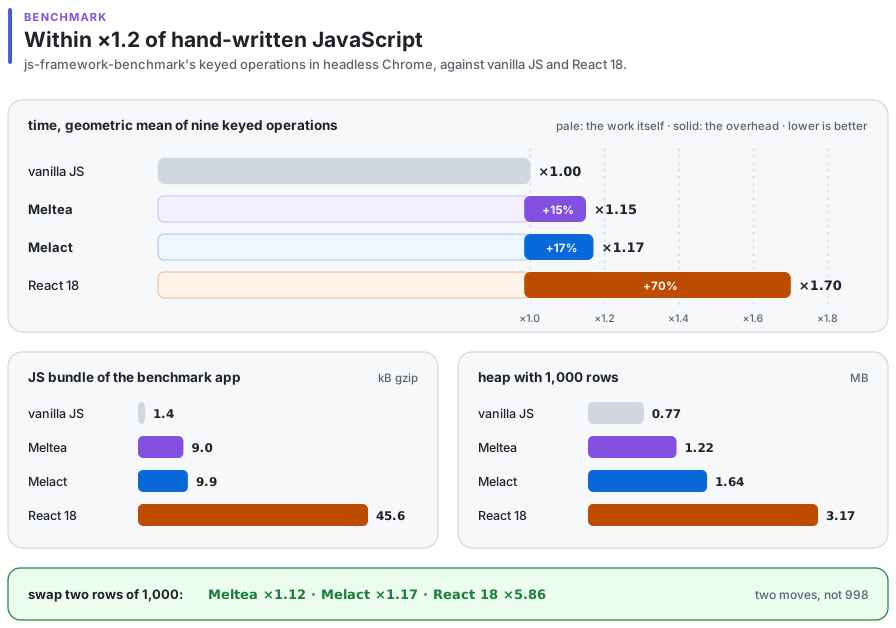
A local reproduction of the keyed CPU, memory and size tests of js-framework-benchmark, in headless Chrome, for Meltea against hand-written vanilla JS
and React 18 with hooks. The ratios move by about 0.1 between runs.
Time, geometric mean of nine keyed operations
Slowdown against hand-written vanilla JS
› Show as a table
| framework | Slowdown against hand-written vanilla JS |
|---|---|
| vanilla JS | ×1.00 |
| Meltea | ×1.15 |
| React 18 | ×1.70 |
JavaScript of the benchmark app
gzip size of all JS in the production bundle
› Show as a table
| framework | gzip size of all JS in the production bundle |
|---|---|
| vanilla JS | 1.4 kB |
| Meltea | 9.0 kB |
| React 18 | 45.6 kB |
Heap with 1,000 rows
After two forced garbage collections
› Show as a table
| framework | After two forced garbage collections |
|---|---|
| vanilla JS | 0.77 MB |
| Meltea | 1.22 MB |
| React 18 | 3.17 MB |
Swap two rows of 1,000
Slowdown against hand-written vanilla JS
› Show as a table
| framework | Slowdown against hand-written vanilla JS |
|---|---|
| vanilla JS | ×1.00 |
| Meltea | ×1.12 |
| React 18 | ×5.86 |
Swapping two rows of 1,000 is two DOM moves in Meltea; React moves 998. A list re-renders only the rows whose item changed.
The whole picture
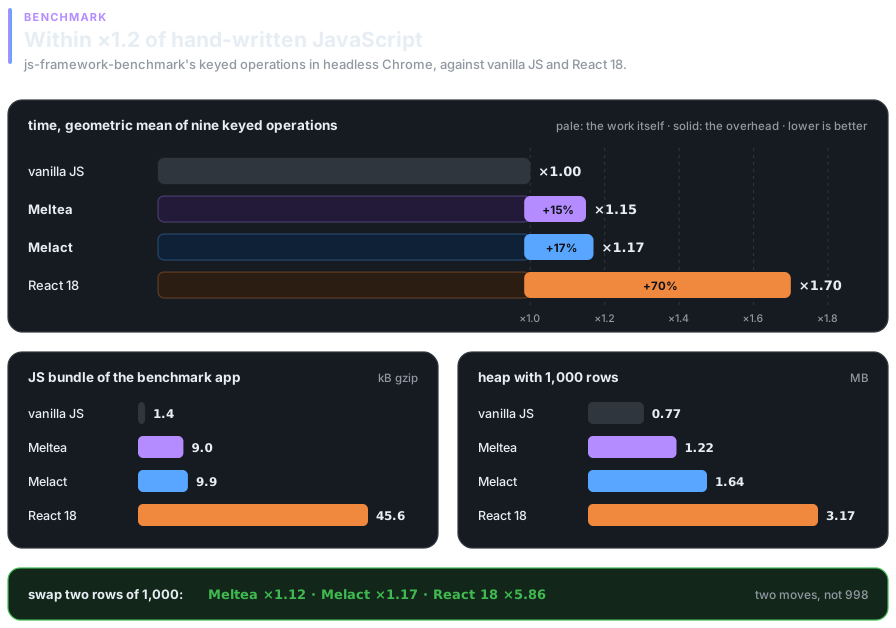
Time, size and memory in one figure.
Whole apps
Small glasses.
Sizes of whole apps, gzip, with the runtime and the Melange stdlib they use included. Unused parts of the runtime drop out of the bundle.
3.0 kB
Counter
the whole app, runtime and the Melange stdlib it uses included
14.7 kB
TodoMVC
most of it jsonkit's Printf for error messages
45 kB
React 18.3 + react-dom
the two libraries alone, before any app code
Method
Measured the way js-framework-benchmark measures.
The four apps render the same markup and share one small inline stylesheet; the harness downloads nothing. Vanilla is hand-written keyed DOM code in
the style of the benchmark's
vanillajs-keyed; React is 18.3 with hooks, like the benchmark's react-hooks.
- Every sample is a fresh tab: load, the benchmark's warmups for that operation, then one measured click, sent as real mouse input.
- The measured click is traced. The time is the renderer main thread's busy time from the start of the click dispatch to the end of the first Paint and its Commit after it.
- CPU slowdown as in the benchmark: 4× for partial update, select, swap and clear, 2× for remove.
- After every measured click the page is checked: row count, every id in order, every label, the markup of every row, and which rows have class="danger". A fast but wrong result is reported, not counted silently.
- Memory: two forced garbage collections, then the heap usage after creating 1,000 rows.
- Size: the gzip (-9) size of all JS in the production bundle.